Number of Houses Built per Year in Two Cities – IELTS Bar Chart
You should spend about 20 minutes on this task.
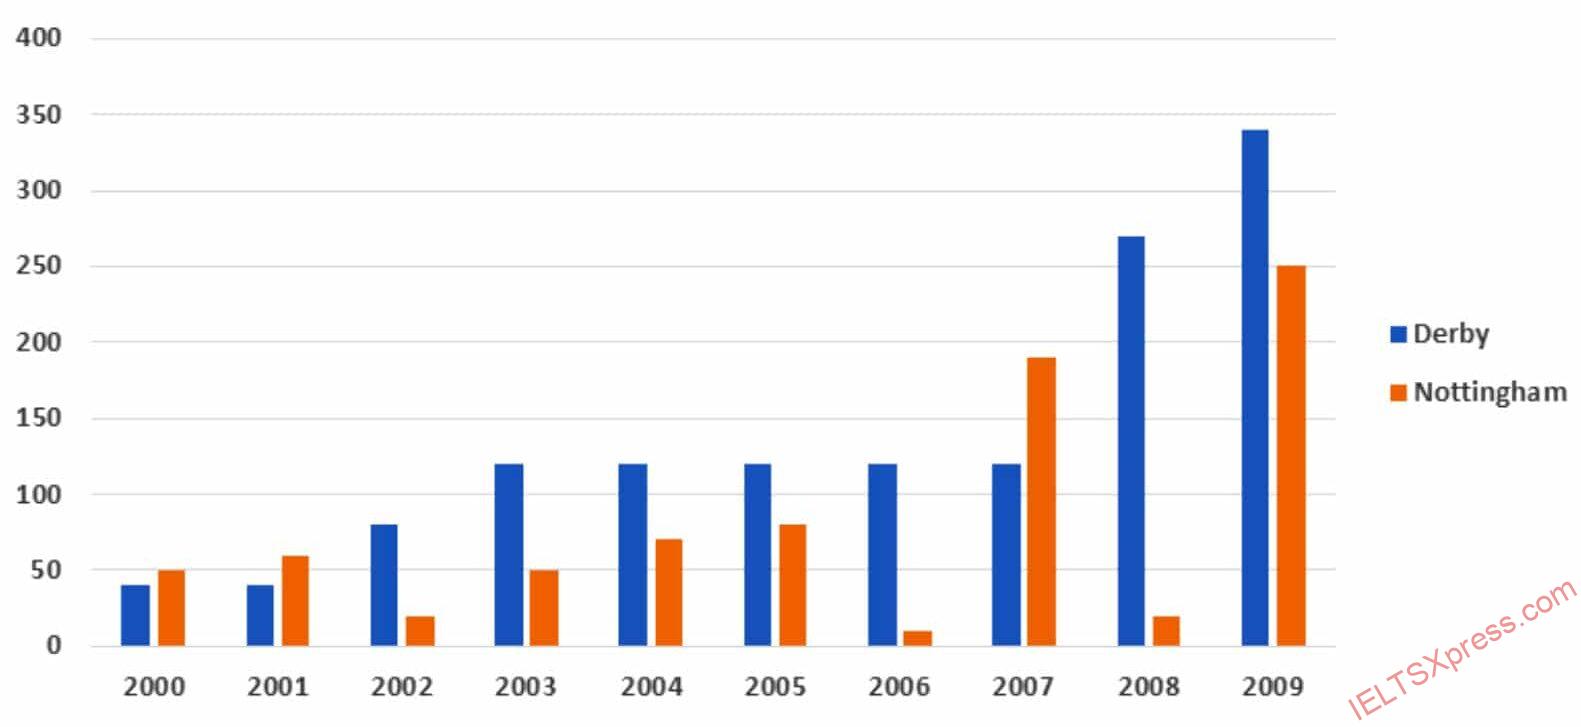
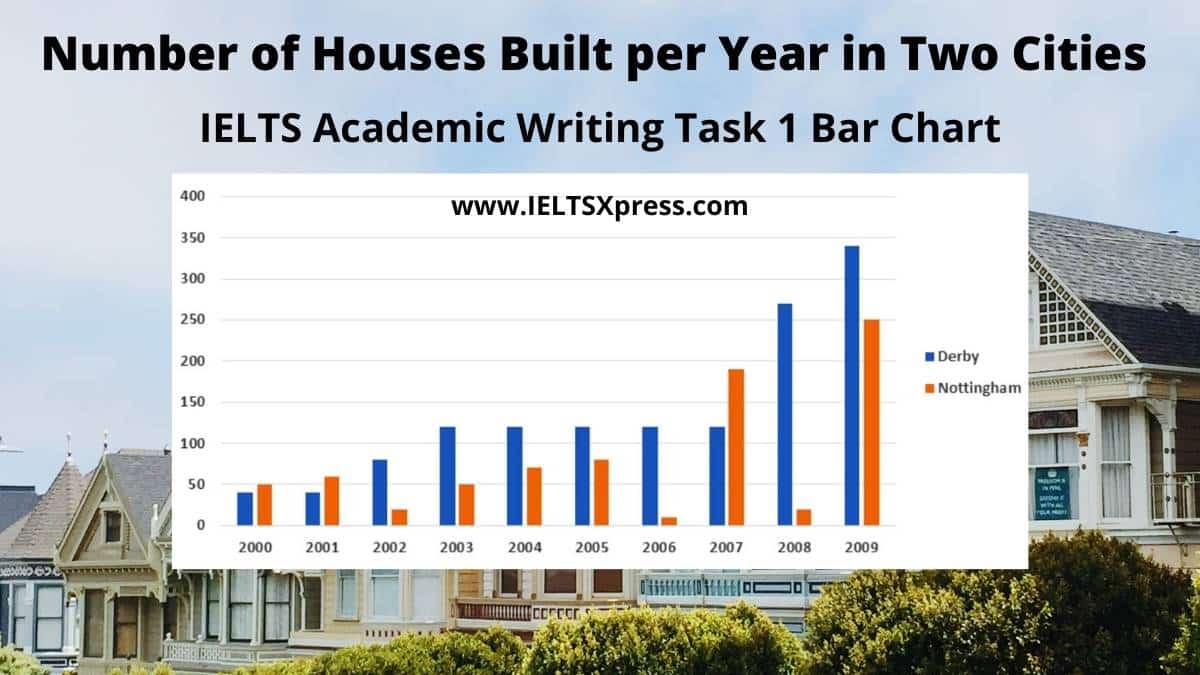
The bar chart below shows the number of houses built per year in two cites, Derby and Nottingham, between 2000 and 2009.

Summarise the information by selecting and reporting the main features and make comparisons where relevant. Write at least 150 words.
Practice with Expert IELTS Tutors Online
Apply Code "IELTSXPRESS20" To Get 20% off on IELTS Mock Test
Number of Houses Built per Year in Two Cities – Sample Answer 1
The graph compares two cites namely Derby and Nottingham in terms of the number of houses built each year, from 2000 to 2009.
Overall, both sets of figures for Derby and Nottingham witnessed an upward trend over the ten-year period. However, while the number of houses built each year in Derby either increased or stayed the same, the figures for Nottingham saw greater fluctuations.
In 2000, the number of newly built homes in Derby was just under 50, and steadily increased over the next three years to reach around 125 houses in 2003. The figures then remained the same for the next four years before dramatically increasing in 2008 and 2009, to reach a figure of approximately 350 homes by the end of the period.
However, the figures for Nottingham followed a rather different pattern. Between 2000 and 2005 the figures for newly built homes fluctuated around 50, before dropping to almost 0 in 2006. A large increase of almost 200 newly built houses was seen in 2007, but the figure then once again dropped to around 10 houses in 2008. 2009 witnessed another surge in the number of new houses, with the figure peaking at 250.


