Global sales of Different Kinds of Digital Games – IELTS Bar Chart
You should spend about 20 minutes on this task.
Real IELTS Exam Question, Reported On:
| India | 19th March 2022 |
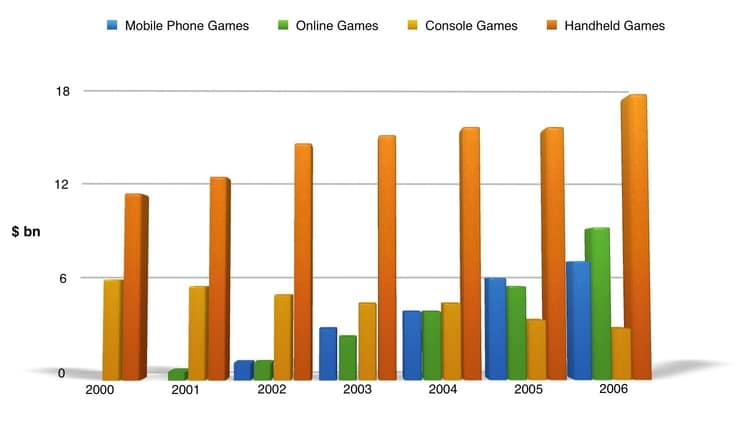
The chart below shows the global sales (in billions of dollars) of different kinds of digital games from 2000 to 2006.

Summarise the information by selecting and reporting the main features and make comparisons where relevant. Write at least 150 words.
Practice with Expert IELTS Tutors Online
Apply Code "IELTSXPRESS20" To Get 20% off on IELTS Mock Test
Global sales of Different Kinds of Digital Games
Sample Answer 1
The given illustration provided data on the sales amount of four different types of digital games from the year 2000 to 2006. The digital game categories are mobile phone games, online games, console games and handheld games. The amount of sales is given in billions of dollars. Overall, the handheld games sales amount was much higher than other types of games’ sales.
According to the given bar graph, console game sale was just below 6 billion dollar while handheld games amounted about 11 billion dollar. No data for other types of game sales in this year was given. Nest year the handheld game sales amount increased to just over 12 billion dollar while console sales amount decreased very slightly and less than 2 billion sales amount was for online games in this year. Throughout the years except 2005, the sales amount for handheld devices increased and in 2006 it reached to about 18 billion dollar. Online games sales amount also increased significantly over the years reaching to over 8 billion dollar in 2006 compared to just 2 billion dollar sales in 2001. The sale amount for console games showed some fluctuations and reached to below 3 billion dollar which is a decline compared to the about 6 billion dollar sales in 2000. Mobile game sales also got its popularity and the amount increased over the year. It reached to over 6 billion sales volume from just 2 billion sales amount 2001. I E LT SX PRSES
The chart below shows the global sales of Different Kinds of Digital Games
Sample Answer 2
Overall, it can be visible that handheld games accounted upward trend throughout the time period. Whereas, Console games recorded downward trend in given time period.
To begin with handheld games, only 13 billion dollars games were sold out in the year 2000 and this figure was steadily increased in between the time period and peaked nearly 18 billion dollars in the year 2006, which was the exceptionally higher selling followed by other years. Moreover, in the year 2000 console were sold out by almost 6 billion dollars, which was dropped by 3 billion dollars in 2006. Although, the trading of console games remained equal in 2003 and 2004, which was nearly 4 billion dollars in both the years.
Furthermore, the least amount of online games were sold in 2001 was only 1 billion dollars and this statistics was steadily expanded by 1 billion dollars till the year 2005 and climbed up by9 billion dollars in 2006. As similar to online games the highest selling of mobile phone games were seen at end of the period around 7 billion dollars,which was quite high amount as compared to other years. In contrast, the minimal selling of that game was around 2 billion dollars in 2002. I E L T S X P R E S S
Digital Games Bar Chart
Sample Answer 3
The bar chart compares the sales figures of four different types of gaming platforms (mobile phones, online, console, and handheld) sold worldwide from 2000 to 2006. The values are given in billion dollars.
Overall, handheld games were always the market leader with a turnover of at least twice as high as the second best-selling category of the year. Console games, however, continued losing their share of the market each year, whereas the figures for the other two categories continued to rise.
Regarding handheld and console games, the former were the market leader with sales reaching just under $12 billion in the year 2000, while the corresponding figure for the latter was approximately half that amount. Over the next six years, sales of handheld games experienced a gradual increase and eventually stood at around $18 billion. However, those of console games declined over the same period and reached their lowest level (approximately $3 billion) in 2006. IE LT S X PRE S S
Turning to online and mobile phone games, we can see that they weren’t very popular when they were introduced to markets (in 2001 and 2002 respectively) since their initial figures were under $3 billion. Nevertheless, both experienced a continual increase in their sales figures over the subsequent years. In 2006, the former became the second best-selling type of game with a turnover of around $9 billion, and the latter came next at about $7 billion.
Bar Chart on Digital Games
Sample Answer 4
The bar chart illustrates the global sales of mobile phone games, online games, console games and handheld games from 2000 to 2006. The measurement is done in billions of dollars.
Overall, it can be seen that from the initial year till the last the sale of handheld games remained high among these games. Mobile phone games, online games, and handheld games experienced an upward trend whereas console games showed a downward trend.
In the first two years, no data had been shown for mobile phone games followed by online games. The sale of online games commenced in 2001 which was 1 billion dollars. Afterwards, their sales increased considerably throughout the period. In 2002 and 2004 the sale of both the games remained equal at around 2 and 4 billion dollars respectively. There was an increase of 3 billion dollars in the sale of mobile games and the sale of online games reached 10 billion dollars in 2006. IELT S XPRE SS
The sale of console games dropped gradually over the period while handheld games increased steadily for the given time period. In 2002, the sale of console games was approximately 6 billion dollars and the sale of handheld games was doubled the sale of console games in that very period. In 2006, the sale of handheld devices increased to 18 billion dollars whereas the sale of console games reached half of its initial period (2000). IELT S XPRESS
IELTS Writing Task 1 Bar Chart
Sample Answer 5
The bar graph compares the worldwide turnover for four kinds of electronic games for a period of seven years, starting from 2000 to 2006. Overall, it can be observed that sales for most of the digital games experienced an upward trend, except for console games. Handheld games had by far the highest number of sales throughout this period.
In 2000, the sales figure for handheld games was close to 10 billion dollars, this figure rose gradually to reach its peak at slightly under 18 billion dollars. In contrast, at 6 billion dollars sales figure, console games were the second most popular games in year 2000. Between 2000 and 2006, this figure continued to drop to hit its lowest point of less than 3 billion dollars.
Global sales for online games and mobile phone games followed a similar pattern with both sales numbers went up considerably for the first 6 years. By the seventh year, sales revenues for both types of games were over 6 billion dollars.
Digital Games Bar Chart Writing Task 1
Sample Answer 6
Overall, handheld games contributed the most and had a steady increase throughout. The figures for console games kept reducing whereas that of online and mobile games continued to grow from their inception in 2001 and 2002 respectively, to the end of the period. ieltsxpress.com
With regards to handheld games, the initial figure was about $11billion in 2000 and saw a continuous growth until 2004 where sales reached approximately $16billion. This amount remained stable the following year before experiencing a rise to $18billion at the end of the period. Similarly, the amounts earned from online and mobile phone games were the same in 2002, being around $1billion, and in 2004, a growth of both to close to $4billion. Although money gotten from playing games on cell phones had surpassed that gotten from online games in years 2003 and 2006, there was a reversal at the end of the period where online games income overtook that of phone gaming at nearly $2billion.
Revenue from console games in the year 2000 stood at $6billion, over half of that of handheld games in the same year. However, the subsequent years witnessed a gradual decline until 2003 where it levelled off in the next year, yet afterwards continued its fall into 2006 where sales generated only amounted to about $3billion- a 50% reduction of the initial figure.
Global sales of Different Kinds of Digital Games
Sample Answer 7
The graph chart illustrates the global sales of different types of digital games between 2000 and 2006. The data are depicted in billions of dollars. Overall, mobile phones, handheld and online games show highest sales in the year 2006 except the console games.
To begin with, online games sales increased steadily from the year 2001 to 2006 with depicts highest sales around 8 billion dollars in 2006. On the other hand, console games selling are fluctuating in the period of six years. Mobile phones and online games show no sales in the year 2000, while mobile phone games still continued to have zero sales in 2001. ieltsxpress.com
All four games together sales begin in last four periods. Console games show almost the same sales of around 5 billion dollars in the first two years of time. Similarly, handheld games show steady sales in the years 2004 and 2005 with approximately 15 billion dollars.
Overall, handheld games are leading in global sales in the period of six years, with the highest sales of 17 billion dollars in 2006.


Former and latter are two word that you use in this bar chart for comparison but seriously those are confusing.(SAMPLE 3)
Former and latter are two word that you use in this bar chart for comparison but seriously those are confusing.