Percentage of Food Budget spent on Restaurant Meals IELTS Task 1
You should spend about 20 minutes on this task.
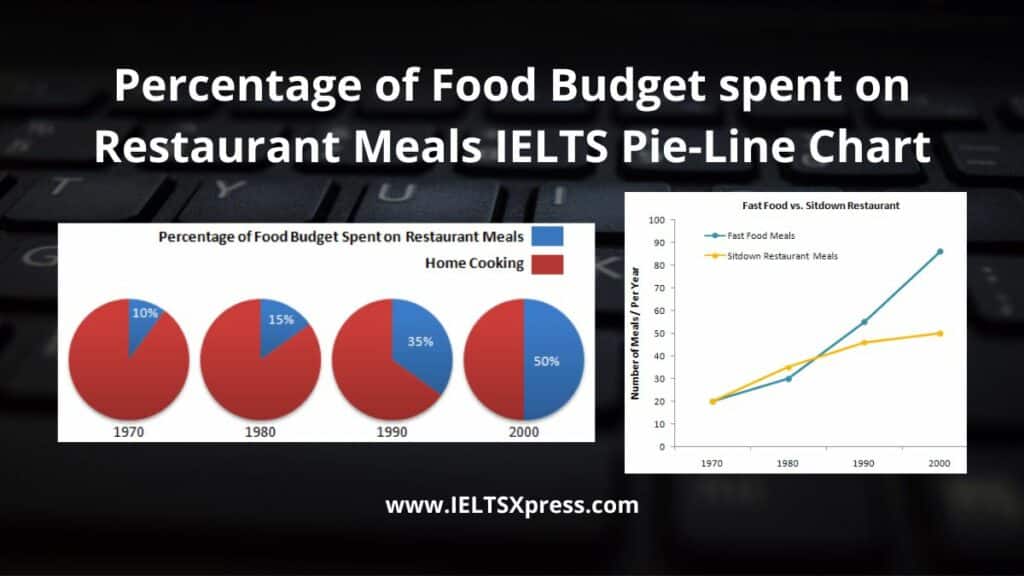
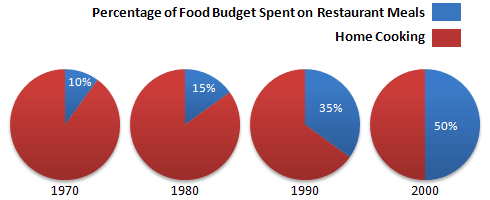
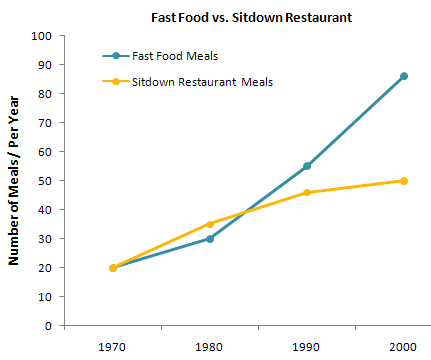
The charts below show the percentage of food budget the average family spent on restaurant meals in different years. The graph shows the number of meals eaten in fast food restaurants and sit-down restaurants.
Write at least 150 words.
Real IELTS Exam Question, Reported On:
| India | 27th August 2022 |
Practice with Expert IELTS Tutors Online
Apply Code "IELTSXPRESS20" To Get 20% off on IELTS Mock Test
Percentage of Food Budget spent on Restaurant Meals IELTS Pie and Line Chart
Sample Answer 1
The expenditure percentage on the food by an average family and the typical number of meals eaten in both fast- food and sit-down restaurants between 1970 and 2000 are elucidated in the given chart.
As per the pie chart, it is clear that the preference for home cooking is seen declining over the three decades from 1970. In 1970, the spending share on restaurant meals was just a tenth, and after a decade, this rose by 5%. However, the latter years (1990 and 2000) saw a considerable surge in this rate: 25 and 40% respectively.
Turning to the information on the number of meals per year, except from 1970 to 1980, fast food meals were the most preferred and it had an exceptional upper hand over the sit-down restaurant meals by 2000. In 1970, both the fast food and sit-down meals were around 20 in number. However, by 2000, the number of fast-food meals went up to over 80, whereas, the others’ number was around 30 less. ieltsxpress
Overall, it is clear,there was an increasing preference towards the restaurant meals, especially the fast food meals over the period.
IELTS Academic Task 1 Combination Chart
The pie charts illustrate the spending on restaurant meals by the typical household across 4 years. The line graph represents the trend in the number of fast food and sit-down restaurant meals across four years.
The preference for dining at restaurants had significantly increased from 1970 to 2000 and the same for home-cooked meals declined. The inclination towards both fast-food and sitdown restaurants rose from 1970 to 2000 but the popularity of fast-food restaurants rose more sharply. [IELTSXPRESS]
The expenditure on restaurants meals were only 10% in 1970 and this percentage grew gradually to 15% in 1980. By 1990 the percentage of food budget spent on restaurant meals grew significantly to 35% and by 2000, 50% of the food budget was spent in restaurants.
The number of meals per year was 20 for both fast-food and sit-down restaurants in 1970. Although the liking for sit-down restaurants grew more than fast-food restaurants initially, the preferences reversed after 1990. Fast food grew sharply whereas that of sitdown restaurants grew at a relatively slower rate.
IELTS Combination Chart Sample Task 1
The multiple pie charts illustrate the percentage of food budget spent on restaurants by an average family in the years ranging from 1970 to 2000. Another line graph compares the number of meals consumed in fast-food and sit-down restaurants over the same time span.
Steady growth in the percentage of food budget spent on restaurant meals can be observed over the years. Starting from a mere 10% in 1970 and reaching a high of 50% in 2000. IELTSXPress
Coming to the number of meals consumed per year in fast-food restaurants, a slight growth from 20 to 30 meals/year between 1970 and 1980. And a rapid escalation from 1980 to 2000, reaching 90 meals/year is vividly noticeable. However, in sit-down restaurants, a gradual increase in the slope from 20 to 50 meals/day from 1970 to 2000 is evident.
Overall, one can say that over the years, fast-food has gained a lot of popularity among most people.
Percentage of Food Budget spent on Restaurant Meals IELTS Academic Task 1
There are two charts shown, and the first is a pie chart which contains the percentage of food budget which people spent on restaurant meals and on home cooking in four decades. And the second one is the line graph illustrates people take Their number of meals in street food and in the restaurant.
Overall, the percentage of spent money on restaurant meals was increased in decades. It rose 10% to 50% in just four decades. However, a number of people wanted fast food around 20% to 90% this range was the rise in every decade. And restaurant food was decreased (45%)Fast food was more on-demand. ieltsxperss
In 1970 and 1980 most of the people like to take meals by cooking at home, and only 10% to 15% of them spent their savings on the restaurant. Other side people preferred junk food and hotels food both around 20% eaten by people in 1970, and it was increased with 25% and 35% in just ten years.
On the other hand, 1990 and 2000 stress food highly rises with 60% to 90% and the restaurant meals was slightly increased approx 45% to 50%. However, people who did not want to eat at home and spent more money on restaurant meals it was increased (15% ) in decades.
Also Check: Diagram Describes the Recycling Process of Aluminum Cans


