The Chart below Shows the Spending by 18-20 Year Olds
You should spend about 20 minutes on this task.
Real IELTS Exam Question, Reported On:
Practice with Expert IELTS Tutors Online
Apply Code "IELTSXPRESS20" To Get 20% off on IELTS Mock Test
| India | 10th November 2022 |
| India | 12th December 2019 |
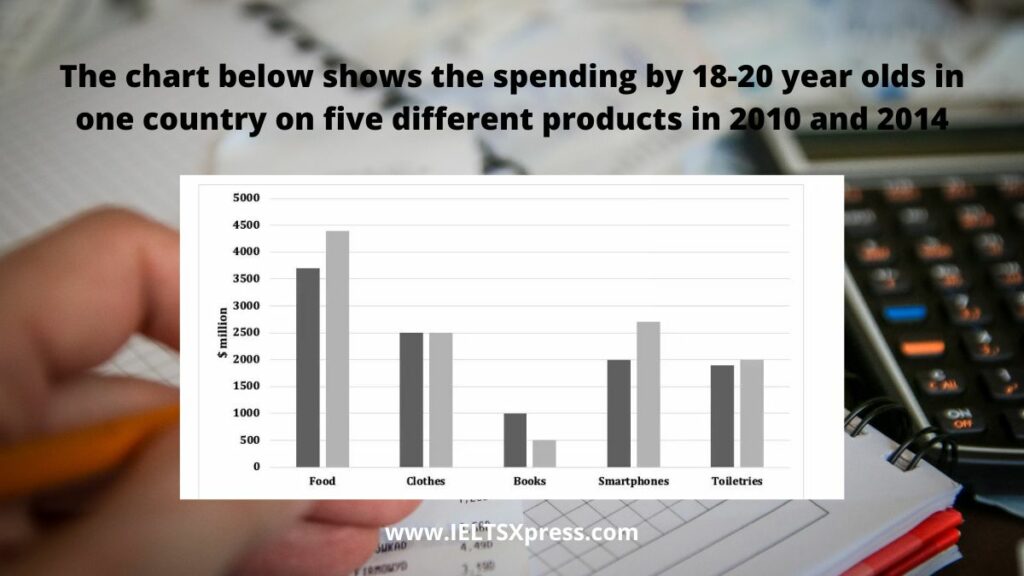
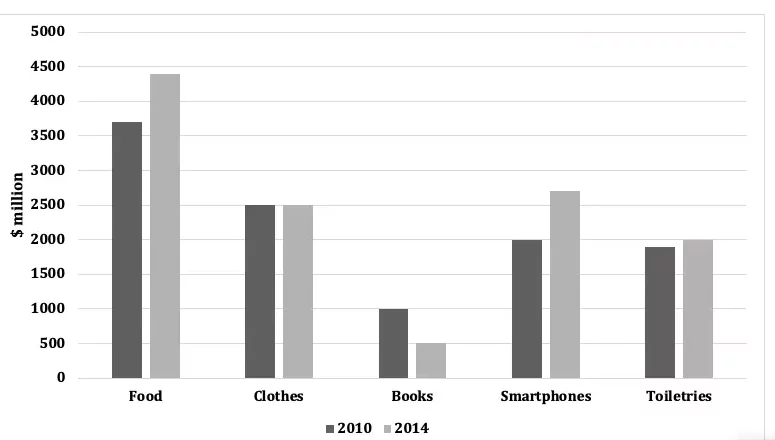
The chart below shows the spending (in millions) by 18-20 year olds in one country on five different products in 2010 and 2014.
Summarise the information by selecting and reporting the main features and make comparisons where relevant. Write at least 150 words.
The Chart below Shows the Spending by 18-20 Year Olds
Sample Answer 1
The bar graph compares the spending of 18-20 year olds on food, clothes, books, smartphones and toiletries in 2010 and 2014 in a particular country.
Overall, it can be seen that the spending on all the products except books and clothes rose with time. Furthermore, the maximum spending was done on food in both the years.
In 2010, the 18-20 year olds spent roughly 3700$ million on food, which was followed by clothes at about 2500$ million dollars. Smartphones and toiletries accounted for about 2000$ million in spending each. The least expenditure was done on books, with a figure of only 1000$ million.
In the next four years, the expenditure on food, smartphones and toiletries increased and in 2010, about 4300$ million were spent on food, whereas about 2700$ million were spent on smartphones. The amount spent on toiletries rose minimally by about 100$ million. By contrast, the spending on books became nearly half. Lastly, the expense on clothes remained unchanged at 2500$.


