UK Survey for the Interest in Sports – IELTS Bar Chart
You should spend about 20 minutes on this task.
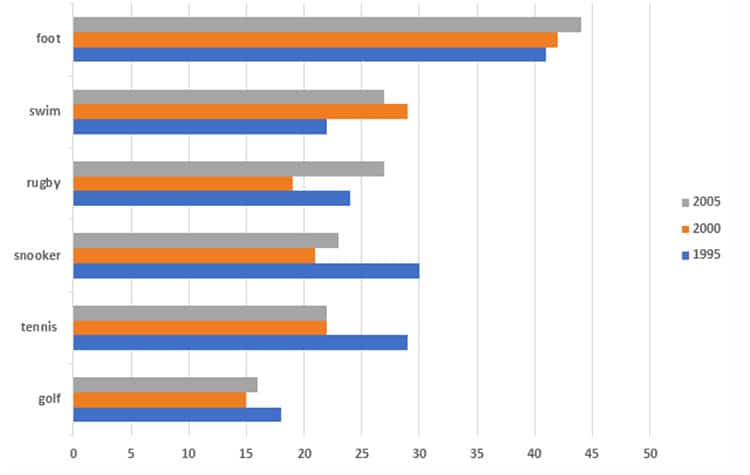
The chart shows the proportion of people in a UK survey carried out in three different years who said they were interested in certain sports.
Summarise the information by selecting and reporting the main features and make comparisons where relevant. Write at least 150 words.
Real IELTS Exam Question, Reported On:
| India | 12th March 2022 |
Practice with Expert IELTS Tutors Online
Apply Code "IELTSXPRESS20" To Get 20% off on IELTS Mock Test
UK Survey for the Interest in Sports – Sample Answer 1
The bar chart shows the percentage of UK residents interested in six different sports, in three years (1995, 2000 and 2005).
It is clear that walking was by far the most popular physical activity in all surveyed years, while golf was the least popular activity. Additionally, the percentages of people who enjoyed walking, swimming and rugby increased, whereas the figures for those who enjoyed other sports decreased over the measured years.
In 1995, walking was the most popular activity, chosen by 40% of the survey participants, while playing snooker and tennis accounted for around 30%. In contrast, about 23% of people chose swimming, while only 18% said they were interested in golf. Meanwhile, approximately 25% of survey respondents chose rugby as their preferred sport.
In 2005, slightly more people preferred walking, with the figure rising to just under 45%, but there was a significant decline in the figures for tennis and snooker, to about 22% each. The figures for golf remained the same, at around 15%, as opposed to the figures for swimming and rugby, which experienced considerable gains in popularity to over 25% each.
Also Check: The Bar Chart below Shows Shares of Expenditures


