Minimum and Maximum Levels of Two Air Pollutants IELTS Bar Chart
You should spend about 20 minutes on this task.
Real IELTS Exam Question, Reported On:
Practice with Expert IELTS Tutors Online
Apply Code "IELTSXPRESS20" To Get 20% off on IELTS Mock Test
| India | 29th September 2022 |
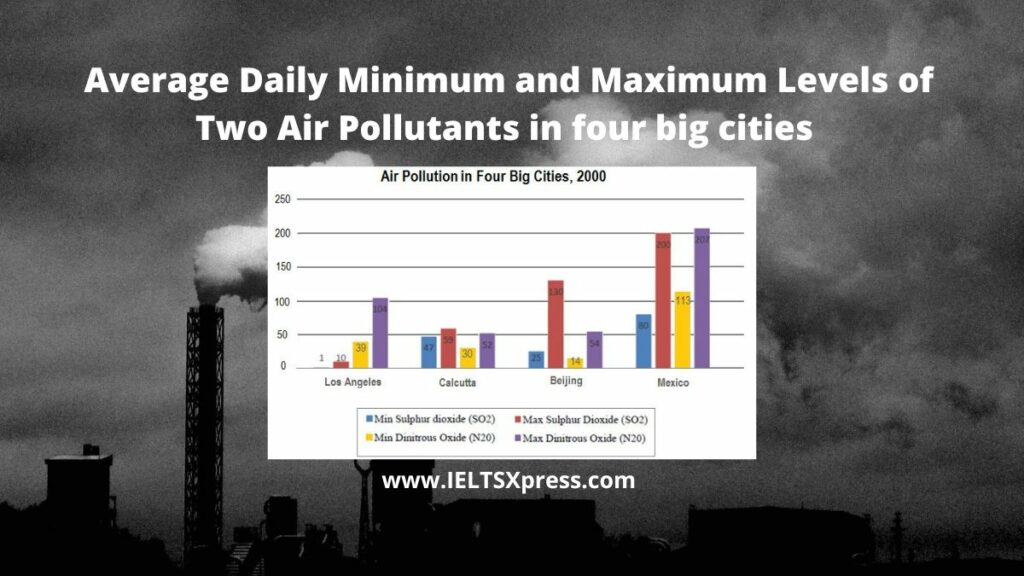
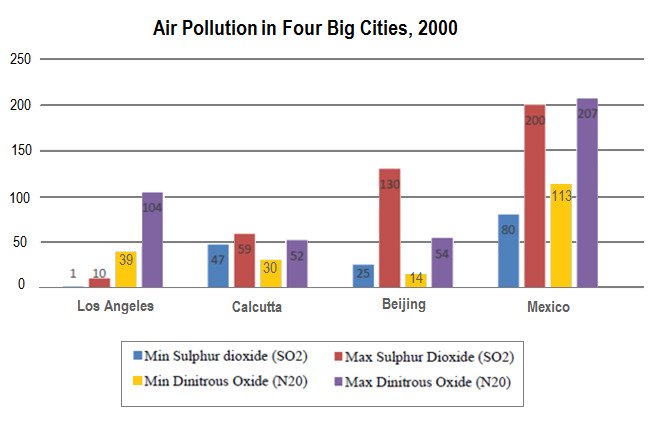
The chart below shows the average daily minimum and maximum levels of two air pollutants in four big cities in 2000.
Summarise the information by selecting and reporting the main features and make comparisons where relevant. Write at least 150 words.
Minimum and Maximum Levels of Two Air Pollutants IELTS Bar Chart
Sample Answer 1
The column chart compares the lowest and highest levels of Sulphur Dioxide (SO2) and Dinitrous Oxide (NO2), two air pollutants, in four cities, namely Los Angeles, Calcutta, Beijing and Mexico in 2000.
Overall, the average presence of these two air polluting ingredients was much higher in Mexico than the other three cities. The higher presence of Sulphur Dioxide and Dinitrous Oxide in Mexico reveal that air pollution in this city is worse than the three other cities.
As is presented in the graph, the level of Sulphur Dioxide in the air of Los Angeles ranges from 1 to 10 which is remarkably lower than that of other cities. The presence of this air pollutant varies from 80 to 200 in Mexico which is the highest. The minimum level of SO2 is 47 in Calcutta and 25 in Beijing but the maximum range goes as high as 130 in Beijing which is more than double than that of Calcutta city.
On the other hand, the presence of the second air polluting material – Dinitrous oxide, on an average, could be found more in the Mexico City’s air than any other city provided in the illustration. The minimum level of N2O in Mexico was 113 which was almost ten times higher than that of Beijing and approximately four times higher than that of Calcutta and Los Angeles. The upper level of N2O in Los Angeles was higher than the presence of N2O in Calcutta and Beijing.
I E LT SX PRSES
The chart below shows the average daily minimum and maximum
Presented in the illustration is the bar chart that lowest and highest levels of two kinds of air contaminants among 4 cities, namely Los Angeles, Calcutta, Beijing, and Mexico, in 2000.
Overall, it is clear that the level of pollution in Mexico is worse and more serious than in other towns. I E LT SX PRSES
To illustrate, the rate of Sulphur in the air of Los Angeles ranged from merely 1 to 10, which was remarkably lower than that of the aforementioned cities. Meanwhile, Mexico had the highest level of this pollutant which varied from 80 to 200 in 2000. Although the minimum level of SO2 was 47 and 25, respectively, in Calcutta and Beijing, the maximum range went up to 130 in the latter town, which was almost double the figure of the former one.
With the second pollutant, Mexico continued to be dominant with the maximum level at 200, which was almost ten times higher than Beijing and four times higher than the data of Calcutta and Los Angeles. At the same time, the upper level of N2O was in Los Angeles higher than Calcutta and Beijing. I E LT SX PRSES


