IELTS Academic Writing Task 1 – Oil Production and Consumption
You should spend about 20 minutes on this task.
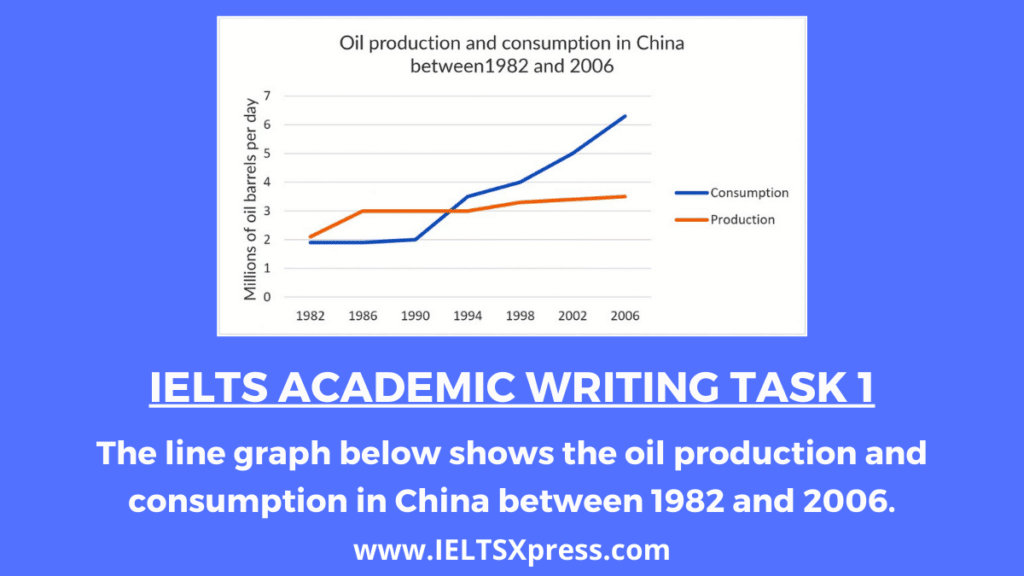
The line graph below shows the oil production and consumption in China between 1982 and 2006.
Summarise the information by selecting and reporting the main features and make comparisons where relevant.
Write at least 150 words.
Model Answer 1: Oil Production and Consumption Line Chart
The line chart illustrates China’s oil production and consumption from 1982 to 2006. It is courted in every million oil barrels per day. In 1982, the consumption and the production of oil had started at the same amount of oil barrels. Things are different after 1982 and the amount between oil consumption and production in China.
The amount of oil production and consumption of China has different development between 1982 and 2006. From 1982 to 1990, the consumption line had been flatted in 2 million oil barrels a day. However, starting in 1990, the oil consumption line is dramatically increased from 2 million to more than 3 million in 1998. Besides, the amounts of oil production have made no changes between 1986 and 1994. Until 1994, the production line has slightly increased to not more than 3 million oil barrels per day. This trend has been kept until 2006. Moreover, in 2006, the oil consumption of China has been continually inclined to more than 6 million oil barrels per day, which is almost twice the 1994’s record.
In conclusion, the oil consumption of China has surprisingly raised from 1990 to 2006, which is totally different to the oil production
Model Answer 2: IELTS Line Chart Oil Production and Consumption
Practice with Expert IELTS Tutors Online
Apply Code "IELTSXPRESS20" To Get 20% off on IELTS Mock Test
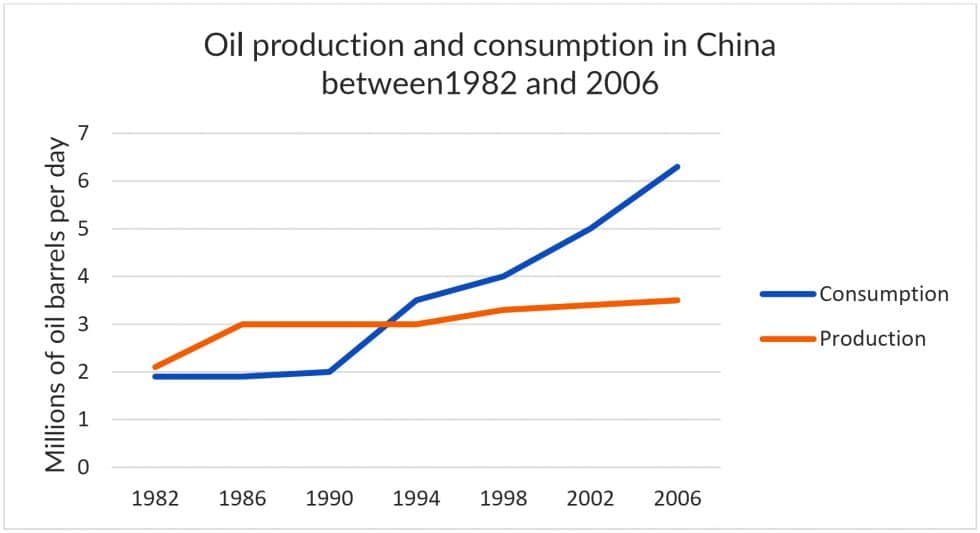
The line chart illustrates how much oil was produced and consumed in China from 1982 to 2006.
Overall, it can be seen that there was an upward trend in both the production and consumption of oil during the given period. In addition, oil consumption climbed significantly faster compared to its production over 24 years.
At the beginning of the period, the figures for both oil production and consumption were nearly equal, at around 2 million barrels per day. After 8 years, the amount of oil produced rose significantly by 1 million and remained unchanged until 1994. Meanwhile, that of oil consumed witnessed stability until 1990, after which it climbed remarkably to 3 million in 1994.
In the second half of the period, the figure for oil production increased slightly to 3.5 million barrels per day. By contrast, the amount of oil consumed grew steadily by 1 million every 4 years, and finally reached a peak of 6 million at the end of the period.
Model Answer 3: Line Chart China Oil Consumption and Production
The graph illustrates how much oil was produced and consumed every day in China, over a 24-year period starting from 1982.
Overall, China witnessed an increase in both the production and consumption of oil over the period shown. However, oil consumption rose significantly faster than that of its production.
At the beginning of the period, the figures for oil production and consumption were both around 2 million barrels per day. However, while the rate of oil consumption rose only slightly over the next eight years, to approximately 2 million barrels per day, oil production increased significantly per day to 3 million barrels per day in 1986, then remained constant until 1990.
From 1990 onwards, the amount of oil that was consumed per day saw steady growth to end up at just over 6 million barrels. Meanwhile, the rate of oil production continued to increase from 1990, but only marginally, ending up at approximately 3.5 million barrels per day in 2006, which was significantly less than the countries consumption rate.
Model Answer 4: Oil Production and Consumption IELTS Line Chart
The chart illustrates the amount of oil produced and consumed in China in the period from 1982 to 2006.
Overall, it is clear that there were upward trends in both oil production and consumption during the period shown. It is also noticeable that oil consumption grew dramatically from 1990.
In 1982, the production of oil had started at the same amount of the oil consumption with around 2 million of oil barrels a day. The amount of oil production slightly increased to 3 million oil barrels per day by 1986. It still remained stable until 1994 and was equal the oil consumption. Then this figure went up steadily to 3.5 million barrels per day over the last 12 years.
Meanwhile, the oil consumed witnessed stability until 1990. After that, it climbed rapidly to 3 million in 1994. This trend had been kept until 1998, which doubled the oil consumption in 1982. This figure continued to rise gradually by 1 million every 4 years and reached a peak of 6 million at the end of the period.
Also Check: The MAGIC of KEFIR IELTS Reading Passage


