IELTS Academic Writing Task 1 – The percentage of the population and the types of houses they live in 3 areas of a city.
You should spend about 20 minutes on this task.
The table below shows the percentage of the population and the types of houses they live in 3 areas of a city.
Summarise the information by selecting and reporting the main features and make comparisons where relevant.
Write at least 150 words.
Model Answer 1: Percentage of the population and the types of houses they live in 3 areas of a city
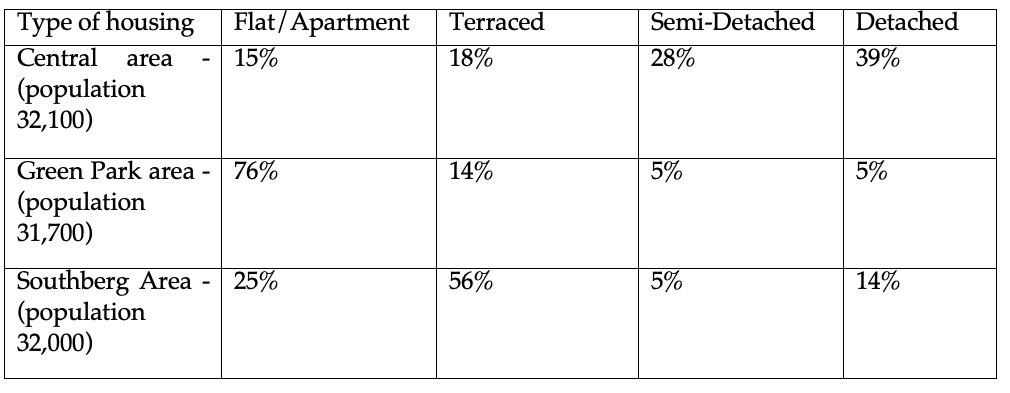
Overall, it is clear from the graph that the population of the three areas is nearly the same. However, there is a considerable difference in the choice of housing, with the maximum residing in detached housing in the Central area, in flats/ apartments, in the Green Park area, and in terraced housing in Southberg Area.
All three areas have a population of roughly 32000. Out of the three areas, flats are the most popular in Green Park and 76% percent of the Green Park population lives in them. By contrast, only 25% of the Southberg inhabitants and 15% of Central area inhabitants live there. Terraced housing is the most preferred by Southberg Area, with a sizable majority (56%) residing there, while only about 15% of the residents in the other two areas like to live in them.
Semi-detached and detached housing, on the other hand, are liked more by Central area residents as compared to the other two areas. 28% of the Central area residents reside in semi-detached housing. By comparison, a mere 5% of residents in Green park and Southberg area live in such houses. In regard to detached housing, the figures stand at 39% for the Central area, 14% for Southberg area, and only 5% for Green Park.
Model Answer 2: Population and the types of houses
The given table compares the population of three areas of a city and types of housing such as Flat, Terraced, Semi-detached and Detached in which people prefer to live.
Overall, It is clear from the graph that despite the population of the three areas being very similar, there is a considerable difference in the choice of housing.
All three areas have a population of about 32000. In the green park area of city individuals, living/ flats are the most popular, and the ratio is amounting to more than 70%, which is three-time of South berg area and 60% more than Central area. Coming to a terraced house, 56% of the Southern area population like to live in terraced houses, but only 14% and 18% of people of Green Park area and Central area live in these types of homes, respectively.
Moreover, in the green park area, people live in semi-detached and detached types of houses, rates are equal, accounting for 5% each. Only 5% of the Southern area population live in semi-detached homes that are about 10% less than the proportion that lives in detached houses. In the Central part of a city, the people live house ratio is highest, it is 39 % which is 11% more than the proportion of people that live in semi-detached houses.
Model Answer 3: Percentage of population and types of houses they live in 3 areas of a city
The given table compares the population and housing of three areas of a city. It is clear from the graph that the population of the three areas is very similar at around 32,000 but there is considerable difference in the choice of housing.
39% of the population of Central Area lives in detached houses. This is in sharp contrast to Green Park Area where only a small minority (5%) lives in detached houses. Even in the Southberg Area, only 14% people reside in detached houses.
The semi-detached houses are less popular in all three areas with 28% of Central Area people living there and 5% each of Green Park and Southberg area living there. Terraced houses are the most popular in Greenberg area with 56% of the people living there. Only 14% people of Green Park area and 18% of Central area people live there.
A large majority of Green Park area people (76%) live in flats or apartments, where as only a quarter of the population of Southberg area lives in apartments. Flats are the least popular among the Central Area people where only 15% people live in them.
Model Answer 4:
The table data compares people’s accommodation in Green Park area, Central area and Central Park area in Denmark in 2012. The types of accommodation listed are terrace houses, semi-detached houses, detached houses and bungalows. Overall, Green park inhabitants preferred terrace houses, while most of the citizens in the Central area lived in terrace-houses and bungalows while the main housing type in Central Park area was Bungalows.
According to the table data, the two-third populace in Green Park area in Denmark lived in terrace houses in 2012. 15% lived in detached houses while the remaining 10% were equally distributed in semi-terrace houses and Bungalows.
Again, Terrance houses and Bungalows were the two most common housing types in the Central area with 45% and 35% dwellers respectively. 15% people in this area were in semi-detached houses and the remaining in detached houses.
Finally, Bungalows were the primary accommodation type in Central Park are with 65% dwellers. One-quarter residents preferred terrace houses and the remaining one-tenth people lived in either a semi-detached or a detached house.
Also Check: IELTS Academic Reading Test 12 History of Woodlands


